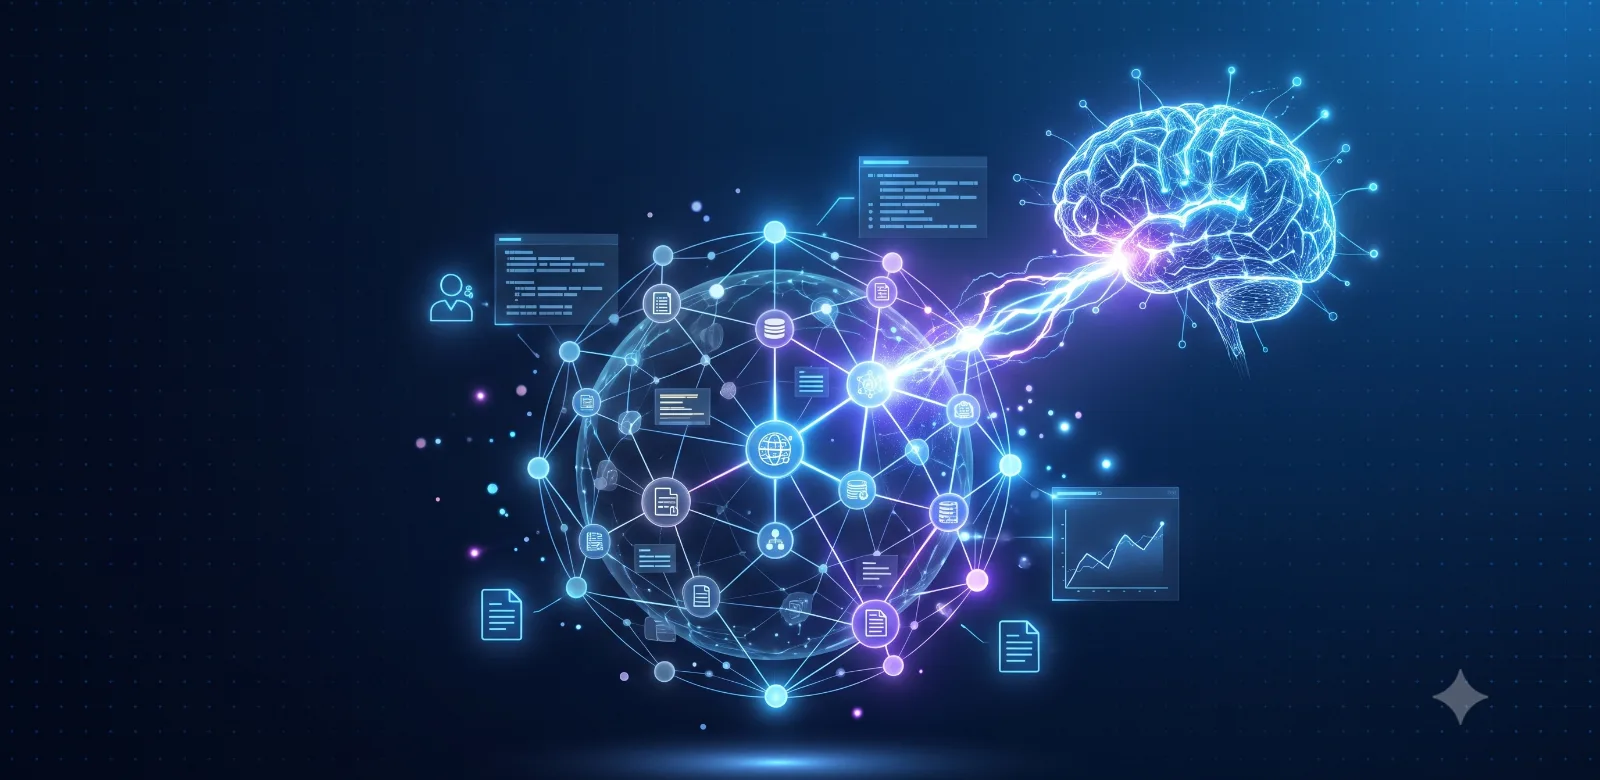
From watching dashboards to understanding systems
Traditional monitoring has a structural limit: it's confined to fixed thresholds — alert if disk usage hits 90% — and only tells you when a system has already stopped working. AI-driven observability explains why it's failing and predicts anomalous behavior in real time, correlating metrics, logs and traces.
In a microservices environment, that limit becomes untenable. IT teams have to trace metrics, logs and traces across hundreds of interconnected microservices when things go wrong — AIOps is built to manage that complexity. A single outage can trigger hundreds of simultaneous alerts from cascading affected services; without intelligent correlation, the team doesn't know where to start.
The three pillars of observability: metrics, logs and traces
AIOps integrates the three pillars of observability: metrics (numeric data showing performance over time — latency, CPU usage, error rate), logs (records of specific events narrating what happened at an exact moment), and traces (a request's path across multiple microservices, letting you pinpoint where the chain breaks).
The open-source stack dominating this layer: Prometheus for real-time metric collection, Grafana for visualization and alerting, and ELK or OpenTelemetry for logs and distributed traces. AI is added as an analytical layer on top of this data, not as a replacement for existing observability infrastructure.
1. Intelligent monitoring: adaptive thresholds
Fixed-threshold monitoring creates two kinds of problems: too many alerts during normal high-load moments (false positives that get ignored) or alerts that arrive late because the threshold was miscalibrated (false negatives resulting in incidents).
Modern platforms use adaptive thresholds that automatically learn each device's normal behavior and set baseline alerts by hour of day — Monday morning behavior differs from Friday afternoon, ecommerce high season differs from the rest of the year.
AIOps platforms can analyze thousands of data points from IT telemetry, identify patterns and alert on potential anomalies before they become incidents — IT teams use them more as intelligence providers than as troubleshooting tools. The dashboard stops being something someone looks at and becomes something that acts.
2. Anomaly detection: the signal in the noise
AIOps platforms ingest and centralize massive data streams from the entire IT ecosystem to create a complete, real-time picture of system health. Using machine learning, they automatically detect anomalies, group related alerts, and flag the likely root cause — instead of generating a hundred separate alerts when a core router fails, they deliver a single root-cause explanation.
The model detects minimal deviations in traffic or resource consumption that usually precede a massive outage or a cybersecurity attack — fatigue signals a human would ignore. The system issues an early alert, allowing the problem to be resolved before it affects operational continuity.
The most relevant 2026 evolution: streaming telemetry over gRPC replaces the traditional pull model, with finer temporal granularity — it lets you find subtle anomalies and transient network fluctuations that weren't detected before. Telemetry arrives in real time, not every 5 minutes.
3. Automatic RCA: from hours to seconds
Manual root-cause analysis in a distributed system can take hours — reviewing logs from dozens of services, correlating events over time, identifying the original cause vs. secondary symptoms.
AI-powered root-cause analysis combines observability data to identify the root cause of problems, and can show how and when certain entities were identified as the likely cause, letting IT teams fix them faster than traditional methods.
Leading platforms identify likely root causes in seconds with AI-based causal reasoning — eliminating hours of manual investigation and significantly reducing MTTR. AI-assisted post-incident analysis generates automatic incident documentation, cutting days of manual work down to minutes.
The full cycle with automatic RCA: anomaly detected → root cause identified → correct team notified with full context → fix flow suggested or automatically executed if pre-approved → post-mortem generated automatically. The ops team no longer investigates — it validates and decides.
4. Incident prediction: before user impact
A prediction system warns that a specific microservice will show a 30% latency increase in the next 15 minutes, before a single user experiences it. That's not monitoring — it's operational intelligence.
Failure prediction includes estimates of disk, CPU or API-error saturation based on historical behavior. Modern systems study current disk and memory space and predict how much space will be used in the future, maximizing space ahead of time so it doesn't affect performance.
Automated analysis can be the difference between triaging an incident for hours and resolving an imminent problem before it happens, reducing downtime and freeing DevOps teams for other tasks. In an ecommerce environment, predicting a performance degradation 15 minutes in advance means the team can scale resources or redirect traffic before the conversion rate drops — not after customers abandon their carts.
5. Performance: from technical metrics to business impact
Leading platforms connect technical metrics with business outcomes — prioritizing fixes based on revenue impact with full visibility into the customer journey. p99 latency on a checkout endpoint isn't an abstract technical metric — it's a number that directly affects conversion rate.
The 2026 evolution is that performance is measured from the user's perspective (Core Web Vitals, TTFB, real load time by user segment) and automatically correlated with infrastructure metrics. When performance degrades, the system already knows which infrastructure metric is the cause, before anyone reports it.
AIOps platforms can also help meet compliance requirements by automatically collecting and maintaining detailed audit logs of system access and data flows, and in the event of an incident, automatically identifying attack vectors, assessing impact, and remediating vulnerabilities faster than traditional response methods.
The 2026 AIOps stack: open source vs. platform
Open source (maximum flexibility, more integration effort): Prometheus + Grafana + OpenTelemetry + in-house ML models. Ideal for teams with platform-engineering capacity and a need for full control over data.
Enterprise platforms (lower time-to-value, cost scaled by data volume): AI solutions for real-time problem detection and performance monitoring; AI-driven analytics observability for multi-cloud environments; predictive analytics and operational automation based on historical data; AI agents with causal RCA and business-impact linkage; and platforms specialized in event correlation and alert reduction for high-log-volume environments.
With the growing shift toward cloud repatriation and stricter data-privacy laws, many organizations look to keep sensitive telemetry within their own security perimeter — getting the benefits of advanced ML and anomaly detection without compromising data sovereignty.
The underlying question
It's not whether you need observability — in a microservices environment, without observability you're flying blind. The question is whether your current observability tells you what happened or why it happened, and whether it can warn you before the problem reaches the user. The difference between those two capabilities is the difference between a team that puts out fires and one that prevents them.
Sources: Gtd Talks AI Observability May 2026, ccnadesdecero.es AIOps Trends 2026, Google Cloud AIOps, IBM AIOps Observability, New Relic AIOps, Site24x7 AIOps Monitoring, KeepCoding AIOps DevOps 2025, ServicePilot Anomaly Detection, NobleProg AIOps curricula — reviewed July 2026.
 Qi-Vanta
Automation and artificial intelligence for businesses. From discovery to production, with measurable ROI.